
Ramya Priya Balasubramanian
Practice Head
December 11, 2024
Home > Blogs > ServiceNow > Mastering Reporting With ServiceNow
Creating a Report
Data
Data provides a name for the report. Here you can also select the source from where (which ServiceNow table) your data comes from.
Type
Type allows you to select the visualization of your report by choosing a report type. There are over 25 report types to choose from. All you must do is select which chart is appropriate for your report.
Configure
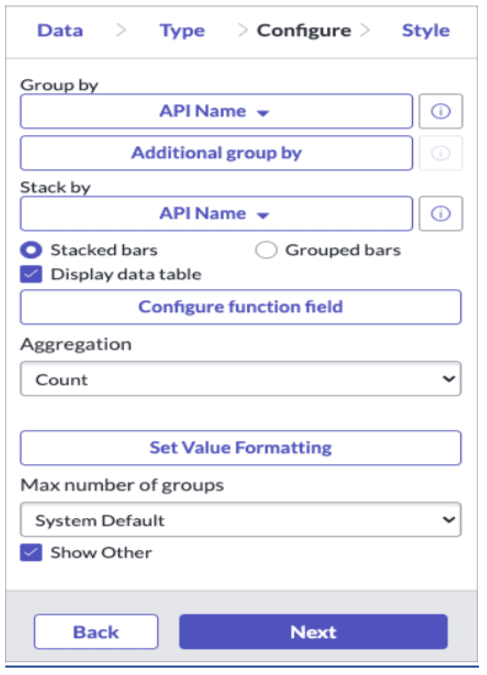
Configure your report by grouping data by a specific field(s) and run calculations against the data. The Configure tab options are dependent on report type.
Style
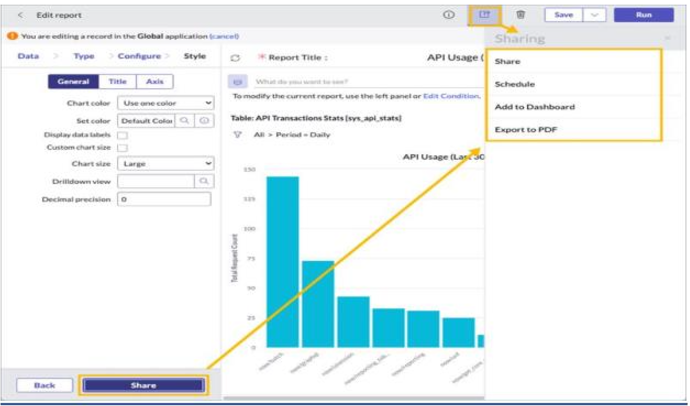
Style allows you to adjust the look of your report, from coloring to the titles, as well as adjusting the report legend.
Sharing Reports
- Me: The user who created the report is the only user able to see the report.
- Everyone: Report developers with the correct roles can select the Everyone option to share a report with
- All logged in ServiceNow user
- All users with a specific role
- Groups and Users: Report developers with the correct roles can select the Groups and Users visibility option to share a report with
- Members of a specified group
- Individual users
Schedule
Scheduled reports are sent as files through email to a list of recipients and run automatically at a pre-determined frequency. The file types for scheduled reports include CSV, XLS, PNG, and PDF.
To test a scheduled report, click the Execute Now button. The Execute Now button is not available until a scheduled report is saved for the first time.
Publishing
For reports to be shared as url links, they must first be published.
Add to Dashboard
You must first Save a Report before choosing this option. Choose Proceed and Save. Then, decide which dashboard and tab (if the dashboard has many tabs) you want the report to appear on.
Export to PDF
Before exporting the report to PDF, you may select the orientation in which you want the report to display and which method of delivery you prefer. Once the export is complete, you may download the report.
Author
Benjamin SamsonRecent Posts
- Revolutionize Your Inventory: Amazon QuickSuite Desktop for Manufacturing Intelligence June 12, 2026
- Mosaic AI Agent Framework on Databricks: The Playbook June 9, 2026
- Copilot in Azure Logic Apps: From Prompt to Production Workflow June 4, 2026
- Copilot in Power Automate: From English Prompt to Working Approval Flow June 4, 2026
- Websites used to be something you built once and basically forgot about. That doesn’t work …Read More »
- Learn how to plan an Optimizely CMS 13 upgrade with .NET 10, Optimizely Graph, Visual …Read More »
- Learn how AI meeting notes automate summaries, action items, and insights from video meetings using …Read More »