Reporting Mechanism in IBM Integration Bus
IBM Integration Bus (IIB)
IBM Integration Bus is the most powerful enterprise integration engine that provides a quick, easy way for applications and systems to communicate with each other. It helps in achieving business values, reduces IT complexity, and saves money.
IBM Integration Bus gives a range of integration options, capabilities, and interfaces to make the best use of the value of existing technology investments. It gives the ability to fulfill business transaction monitoring and is an essential platform for analytics.
Reporting Options
IBM Integration Bus has undoubtedly created interest to monitor message flows. A reasonable improvement in this area has been made with the inclusion of monitoring events and the Business Transaction Monitoring functionality.
In IBM Integration Bus, message flow statistical data can be collected to note performance and operating details of one or more message flows. Message flow data capture dynamic information about the runtime behavior of a message flow. For instance, it can show counts of processed messages, size of messages, processor usage, and elapsed processing times.
Indigenous Monitoring Capabilities of IBM Integration Bus
The developers can ask for monitoring events to be released when the message flows execute while defining message flows in Integration Toolkit. These events can subsequently be received and utilized by monitoring applications such as IBM Business Monitor. The Business Transaction Monitoring (BTM) functionality of IBM Integration Bus and custom applications to track the message flows or the business transactions performed by IBM Integration Bus.
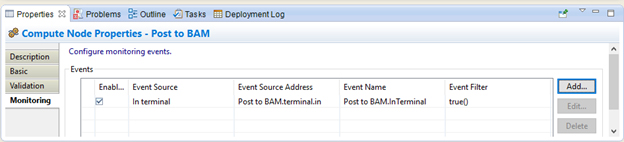
Setting Message Flows to Release Monitoring Events
When establishing a message flow using the IBM Integration Toolkit, a developer can configure it to release events. These settings are situated in the “Monitoring” page of the properties of the nodes: From the “Monitoring” page, events can be added to the selected node or edited.
1. Business Transaction Monitoring
A business transaction might be executed as several user transactions or activities. A transaction could be an IIB message flow or it may enclose numerous IBM Integration Bus message flows involved in the processing of the same data in a particular order.
IBM Integration Bus contains functionality for monitoring business transactions, named “Business Transaction Monitoring.”
The global architecture used by this functionality has the following parts:
The upstream part of the architecture is the procedure for producing monitoring events as MQ messages and addressing them to MQ topics.
The downstream part includes:
An internal piece of IBM Integration Bus (IIB) which subscribes to the topics to get the tracking events and record in a database.
2. IBM Business Monitor
We can use IBM Business Monitor to track message flows or business transactions implemented by IBM Integration Bus. IBM Business Monitor needs to be purchased besides IBM Integration Bus.
3. Custom Monitoring Applications
It is also workable to implement custom applications for observing the message flows and the business transactions. These applications must subscribe to the MQ topics used by IBM Integration Bus to get the monitoring events. Bring out the statistics about the flows from the events and keep them somewhere, then provide a GUI to allow the administrators to get access to the information about the flows and perform the analysis. The Advanced Monitoring Asset (AMA) for IBM Integration Bus is a custom monitoring application applied according to these principles.
3.1 Advanced Monitoring Asset for IBM Integration Bus
The Advanced Monitoring Asset (AMA) for IBM Integration Bus was designed to monitor IBM Integration Bus message flows and to broaden the Business Transaction Monitoring capabilities of IBM Integration Bus (IIB).
Allows the monitoring of flows executed on multiple integration nodes from a single GUI.
Gives complete data about the flows plus sorting and filtering capabilities.
Provides statistics about the throughputs, the processing times, etc.
The Advanced Monitoring Asset is owned by the IBM Cloud Services organization which can be acquired by customers keen to get advanced monitoring capabilities for IBM Integration Bus.
Main Functionalities
The predominant functionalities given by the Advanced Monitoring Asset (AMA) for IBM Integration Bus are:
- Brings out data related to the business flow instances executed by IBM Integration Bus (IIB) from the tracking event messages produced by the message flows and save into a database.
- Provide a GUI allowing administrators to query, show, and analyze the data.
The GUI part of the asset provides the following functionalities:
- Query the business flow data from the database with sorting/filtering using diverse criteria (type of business flow, period of time, integration node, integration server, business data) and displays the data retrieved as a table.
Show statistics as bar charts related to the business flow instances fetched through a query. Various graphs/reports are offered:
About the execution times by periods of time
About the throughputs by periods of time.
About the throughputs by nodes/servers and by types of business flows.
Architectures
The architecture is created as another tracking application which subscribes to the monitoring events released by the IBM Integration Bus message flows. It shares the same base and some usual features with the “BTM” functionality of IBM Integration Bus. On the other hand, the Advanced Monitoring Asset subscribes to a separate topic, saves data into a database with a different formation, and the GUI is also distinct.
Setup
Allowing the Message Flows to Produce Monitoring Events
To get these settings with the IBM Integration Bus Toolkit, open the message flow with the editor, pick a node, and fetch the “Monitor” tab in the “Properties” view.
The precise detail of the Advanced Monitor Asset is given below:
We can match up together events coming from various integration nodes and servers.
It is workable to have multiple start events and multiple ends or unsuccessful events for a business flow instance.
The event name is utilized to carry the business flow type and the status.
Using the GUI
It is a web application which can be accessed using a browser. It first displays the main menu:
Querying/Listing Business Flow Instances
Using Advanced Monitoring Asset’s “See all business flows” option, the business flow instances equivalent to selection criteria can be fetched from the database and showed as a scrollable table.
The business data used for filtering are those described as the “Event payload” property of the message flow nodes.
Both basic and complex data can be used for filtering:
For basic data, only the name and value must be identified.
The name must have a path to the single data for complex data.
In the list of results, completed business flow instances are displayed in green, while unsuccessful business flow instances are shown in red, and in-process instances in orange.
The columns are as follows:
The ID of the business flow instance
The current status (either “Started,” “In-process,” “Completed”, or “Failed”)
Start time
End time
The business flow type
The integration nodes and servers which carry out the business flow instance
The business data (explained as the “Event payload” property of the nodes).
Using (“See all failed business flows”) option, you can limit the query to unsuccessful business flow instances only, matching selection criteria, and show them as a scrollable table.
Showing Information about the Business Flow Instances
From the list of business flow instances fetched by a query, it is possible to show various kinds of statistics.
The figures are displayed as bar charts built using HighCharts, a high-quality framework for creating business charts.
Information about Throughputs by Periods of Time
The first kind of statistics shows information about the numbers of business flow instances executed by periods of time. We can change the period of time used for splitting the data (by years, months, weeks, days, hours, minutes, seconds) using “More details (time)” and “Less details (time)”.
Conclusion
IBM Integration Bus message flows can be tracked in multiple ways. First, IBM Integration Bus gives infrastructure for producing monitoring events and addressing them to MQ topics. Next, multiple applications can use these events to give administrators with monitoring information. The first one to be examined is the Business Transaction Monitoring (BTM) functionality of IBM Integration Bus. If client’s expectations cannot be handled with this functionality, other possibilities such as the Advanced Monitoring Asset for IBM Integration Bus can be used. Royal Cyber’s Transaction Pro is another remarkable alternative which can be used to monitor not only IIB flows, but correlate and track transactions occurring across DataPower, IIB, and MQ. More details can be found here: Transaction Pro